Precomputed heatmaps
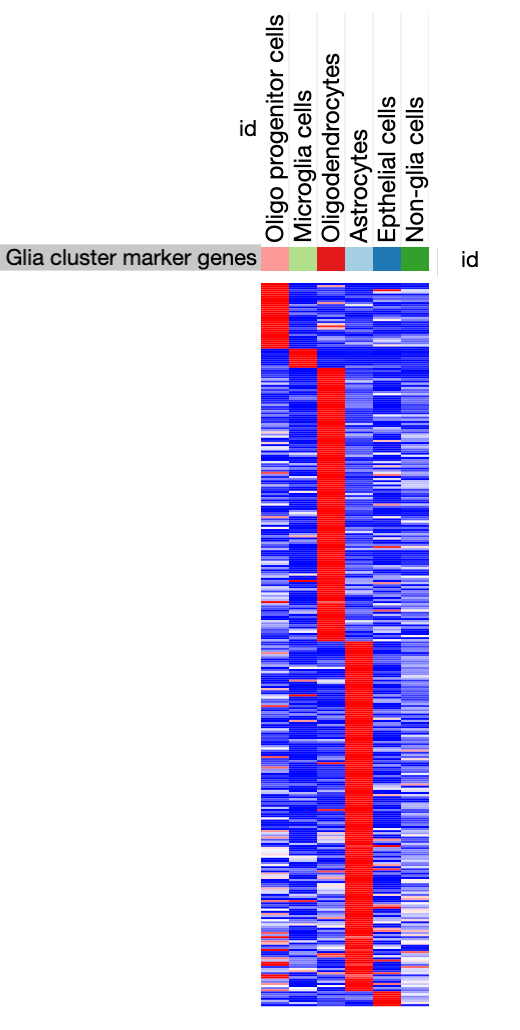
Purpose: Panels of genes are often important results in analysis, identifying cohorts of genes that drive differences between cell states. These gene lists can be derived by many methods (eg. differential expression, enrichment analysis, and expert knowledge). Multiple lists of precomputed expression stats can be uploaded which will allow others to explore the genes in the list. Precomputed data is displayed as a heatmap, with genes as rows. Columns can be groupings of cells (e.g. clusters or annotation labels etc. to visualize differential gene expression) or genes (e.g. for visualizing gene-gene expression correlation). Different authors may wish to use different methods to summarize genes over a group of cells (like an average, trimmed average, or median expression of the gene in cell groups), supplying those summary measurements gives you complete control over the method used. To communicate expression patterns, the expression data in the file should be pre-clustered so that coordinately expressed genes are listed adjacent to each other in the file.
 Example: precomputed heatmap from SCP1.
Customizations for precomputed heatmaps:
Options dropdown name: The dropdown for precomputed heatmaps is titled "Precomputed heatmaps" by default. A more descriptive name (e.g. Differentially expressed genes, Correlation matrix etc.) may be provided within "Study settings -> View options" -> "Precomputed heatmap menu label" to more precisely describe the precomputed heatmap.
Description: For each precomputed heatmap file, provide a brief description of the method used for precomputation. This sentence will appear above the heatmap in the visualization.
Computed value name (legend label): For each precomputed heatmap file, provide a short label in the "Computed value name" field that will annotate the colorbar that accompanies the heatmap (default: Computed expression)
Color scale:
- Row-relative - minimum and maximum values within each row are used to convert values to colors. (recommended for gene expression heatmaps)
- Specify color range - actual values converted to colors thresholded at specified min/max values (defaults: max = 1, min -1). (recommended for correlation heatmaps)
Format: This is a tab-delimited file of at least 2 columns.
Columns: The first column contains the gene names, these names should match gene names in other documents in your study. You may include an arbitrary number of genes and need not include all the genes in your study. As well, different gene lists may partially overlap as needed. The next columns are the measurement (like an average expression) of the genes in different categorical metadata groupings of interest. There can be many columns representing different categorical metadata groups.
Rows: The first row starts with the entry "GENE NAMES" and the name of the categorical groupings from metadata for which one would like to provide summary measurements (like averages within that group). Each row after the first row starts with a gene name and then the summary measurement for that gene in the cells that are a part of the metadata grouping for that column. By default, genes are presented in the heatmap in the order they are listed in the precomputed heatmap file.
Example Marker Gene Lists File
Note: Not required for study visualization.
Comments
0 comments
Please sign in to leave a comment.